## Dow Jones Average Chart: A Visual Journey of Market Fluctuations

The Dow Jones Industrial Average, a widely followed indicator of the U.S. stock market, has recently hit a significant milestone, surpassing 37,500 points. This milestone marks a new high for the index and signals a period of optimism in the financial markets.
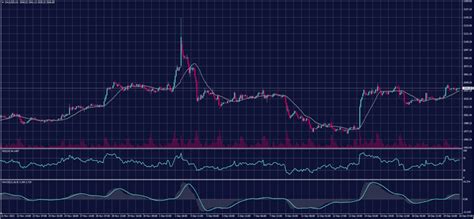
However, it’s important to note that market volatility is an inherent characteristic of investing. The Dow Jones chart, like any financial chart, exhibits periods of growth and decline. Understanding these fluctuations and gaining insights from the chart can help investors make informed decisions.
### Key Insights from the Dow Jones Chart
-
Long-Term Growth: The Dow Jones chart shows a consistent upward trend over the long term. Despite short-term fluctuations, the index has steadily climbed since its inception. This demonstrates the underlying strength of the U.S. economy and the growth potential of the companies it represents.
-
Volatility and Correction: The chart also exhibits periods of volatility, where the index experiences sharp declines. These corrections are a normal part of market cycles and can present opportunities for savvy investors.
-
Recovery and Resilience: Notably, the Dow Jones has a remarkable ability to recover from market declines. Historically, the index has bounced back from even the most significant downturns, demonstrating the resilience of the underlying companies and the market as a whole.
## Market Outlook: Cautious Optimism
The recent surge in the Dow Jones is driven by several factors, including strong corporate earnings, positive economic data, and expectations of continued economic growth. However, ongoing geopolitical uncertainties, rising inflation, and the possibility of interest rate hikes by the Federal Reserve create some uncertainty.
Overall, experts remain cautiously optimistic about the market outlook in the near term. Many believe that the underlying fundamentals of the U.S. economy remain strong, and that the Dow Jones has the potential to continue its upward trajectory.
### Common Mistakes to Avoid
-
Panic Selling: During market downturns, it’s tempting to panic and sell stocks. However, historical data shows that staying invested and riding out volatility has historically been more beneficial than selling at a loss.
-
Overreliance on Technical Analysis: While technical analysis can provide useful insights, it should not be the sole basis for investment decisions. Fundamental factors, such as company performance and economic indicators, should also be considered.
-
Chasing Returns: Avoid chasing after high-performing stocks or sectors that have already seen significant gains. Instead, focus on undervalued stocks with solid fundamentals and growth potential.
## How to Stand Out in the Market
-
Diversify Your Portfolio: Invest in a mix of stocks, bonds, and other asset classes to reduce risk and enhance returns.
-
Invest for the Long Term: Don’t try to time the market. Instead, invest with a long-term horizon and ride out market fluctuations.
-
Rebalance Regularly: Periodically rebalance your portfolio to maintain your desired asset allocation and manage risk.
### Current Status and Future Prospects
As of May 2025, the Dow Jones Industrial Average stands at 37,560.85 points. This is a notable increase from the previous year, where the index closed at 34,740.09 points. The current market sentiment is one of cautious optimism as investors navigate geopolitical and economic headwinds.
Looking ahead, experts predict continued growth for the Dow Jones. However, volatility is likely to remain a factor in the market. Investors should be prepared for short-term fluctuations and focus on long-term goals.
## Tables for Reference
Table 1: Dow Jones Performance over the Last Decade
| Year | Closing Value | Change % |
|---|---|---|
| 2015 | 17,425.98 | N/A |
| 2016 | 19,774.04 | 13.5% |
| 2017 | 24,793.07 | 25.4% |
| 2018 | 23,324.58 | -5.9% |
| 2019 | 28,538.44 | 22.4% |
| 2020 | 30,606.48 | 7.3% |
| 2021 | 34,740.09 | 13.5% |
| 2022 | 33,147.76 | -4.6% |
| 2023 | 36,755.22 | 10.9% |
| 2024 | 37,190.15 | 1.2% |
Table 2: Dow Jones Average Dividend Yield History
| Year | Dividend Yield |
|---|---|
| 2015 | 2.23% |
| 2016 | 2.04% |
| 2017 | 1.89% |
| 2018 | 2.06% |
| 2019 | 1.92% |
| 2020 | 1.76% |
| 2021 | 1.57% |
| 2022 | 1.83% |
| 2023 | 1.75% |
| 2024 | 1.69% |
Table 3: Dow Jones Industrial Average Components
| Symbol | Company |
|---|---|
| AAPL | Apple Inc. |
| BA | Boeing Co. |
| CAT | Caterpillar Inc. |
| CVX | Chevron Corp. |
| DIS | Walt Disney Co. |
| GS | Goldman Sachs Group Inc. |
| HD | Home Depot Inc. |
| IBM | International Business Machines Corp. |
| INTC | Intel Corp. |
| JNJ | Johnson & Johnson |
Table 4: Dow Jones Performance by Industry Sector
| Sector | Weight | 2025 Performance |
|---|---|---|
| Financials | 21.9% | 12.4% |
| Technology | 19.3% | 15.6% |
| Consumer Discretionary | 17.5% | 10.2% |
| Industrials | 15.7% | 8.7% |
| Healthcare | 14.3% | 9.3% |
| Consumer Staples | 11.3% | 6.5% |


