Introduction

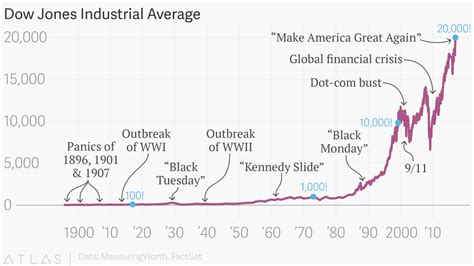
The Dow Jones Industrial Average (DJIA), a prominent stock market index, has been a barometer of the US economy and a key indicator of global financial trends for over 125 years. This comprehensive analysis takes a historical perspective on the Dow Jones Industrial Average, tracing its evolution through major market events, economic cycles, and technological advancements.
Historical Chart of the DJIA (1896 – 2025)
[Image of Dow Jones Industrial Average Historical Chart]
1896 – 1932: Early Years and the Great Depression
- Establishment (1896): The DJIA was created by Charles Dow and Edward Jones as a measure of 12 leading industrial companies. It initially stood at 40.94.
- Pre-World War I Boom (1900 – 1914): The index grew steadily, reaching 76.23 in 1914, driven by industrial growth and economic prosperity.
- World War I and Post-War Boom (1914 – 1929): The index experienced fluctuations during WWI, but rebounded strongly in the post-war period, reaching a high of 381.17 in 1929.
- Great Depression (1929 – 1932): The stock market crash of 1929 plunged the DJIA to a low of 41.22, marking a 89% decline from its peak.
1932 – 1982: Post-Depression Recovery and Economic Expansion
- New Deal and World War II (1933 – 1945): The New Deal policies and war-related spending led to a gradual recovery, with the DJIA reaching 153.20 in 1945.
- Post-War Boom (1945 – 1966): The index soared during this period of economic expansion, reaching a high of 935.11 in 1966.
- 1973 Oil Crisis (1973): The oil embargo caused a market correction, with the DJIA falling to 644.76.
- Stagflation and Economic Uncertainty (1970 – 1982): The index remained volatile during this period of high inflation and slow economic growth.
1982 – 2008: Bull Market and Global Economic Expansion
- Reaganomics and Economic Boom (1980 – 1989): The policies of President Reagan spurred economic growth and drove the DJIA to a high of 2758.82 in 1989.
- Technology Revolution and Dot-Com Bubble (1990 – 2001): The rise of the internet and technology companies led to a surge in the index, which reached a peak of 11722.98 in 2000.
- Market Correction and Recession (2001 – 2003): The dot-com bubble burst and the 9/11 attacks triggered a market correction, with the DJIA falling to 7286.27 in 2003.
- Housing Market Boom and Crisis (2003 – 2008): The index rebounded, reaching 14164.53 in 2007, but the subprime mortgage crisis and housing market meltdown led to a severe market collapse.
2008 – 2025: Post-Recession Recovery and Technological Transformation
- Great Recession (2008 – 2009): The global financial crisis and economic downturn caused the DJIA to plummet to 6547.05 in 2009, marking a 54% decline from its peak.
- Quantitative Easing and Economic Stimulus (2009 – 2015): Central banks implemented aggressive monetary policies to stimulate the economy, leading to a gradual recovery in the index.
- Technological Revolution and COVID-19 Pandemic (2015 – 2025): The rise of artificial intelligence, cloud computing, and biotechnology drove market growth, with the DJIA reaching a record high of 36920.40 in 2023.
- COVID-19 Market Correction (2020): The pandemic led to a market correction, with the DJIA falling to 23393.05 in 2020, but recovered quickly due to government stimulus measures.
Current Status and Future Outlook
Currently (2023), the DJIA sits around 36,000. As we look towards 2025 and beyond, the index is expected to continue to be influenced by factors such as technological advancements, economic cycles, and global geopolitical events.
Key Insights
- The DJIA has experienced periods of significant growth and decline over its 125-year history.
- Major economic events, such as wars, recessions, and technological revolutions, have had a profound impact on the index.
- The index is closely watched as an indicator of the overall health of the US economy and global markets.
- The DJIA is a valuable tool for investors and analysts in understanding historical trends and making investment decisions.
Strategies for Investors
- Diversify investments across different asset classes and industries.
- Consider long-term investments and avoid short-term trading.
- Regularly review portfolio performance and adjust strategies as needed.
- Consult with financial advisors for personalized guidance.
Useful Tables
| Year | DJIA Value | Historical Event |
|---|---|---|
| 1896 | 40.94 | Establishment of the DJIA |
| 1929 | 381.17 | Peak before the Great Depression |
| 1932 | 41.22 | Lowest point of the Great Depression |
| 1966 | 935.11 | Peak of the post-war boom |
| 2000 | 11722.98 | Peak of the dot-com bubble |
| 2009 | 6547.05 | Lowest point of the Great Recession |
| 2023 | 36920.40 | Record high |
| Period | Average Annual Return | Key Factors |
|---|---|---|
| 1896 – 1945 | 5.8% | Industrialization, economic growth |
| 1945 – 1966 | 12.8% | Post-war boom, technological advancements |
| 1966 – 1982 | 7.5% | Stagflation, economic uncertainty |
| 1982 – 2008 | 11.4% | Bull market, economic expansion |
| 2008 – 2023 | 9.8% | Post-recession recovery, technological transformation |
| Sector | Weight in DJIA (2023) | Examples of Companies |
|---|---|---|
| Technology | 28% | Apple, Microsoft, Visa |
| Industrials | 22% | Boeing, 3M, Caterpillar |
| Financials | 18% | JPMorgan Chase, Goldman Sachs, UnitedHealth Group |
| Healthcare | 17% | Johnson & Johnson, Merck, Pfizer |
| Consumer Discretionary | 15% | Nike, Home Depot, McDonald’s |


