Introduction
The Weighted S&P 500 Index, a cornerstone of the financial landscape, serves as a benchmark for countless portfolios and a barometer of the U.S. stock market’s overall health. This article delves into the intricacies of this esteemed index, unraveling its components, methodologies, and unwavering significance for investors.

Understanding the Weighted S&P 500 Index
The S&P 500 Index, introduced in 1957, comprises 500 of the largest publicly traded companies in the United States. Unlike other market-capitalization-weighted indices, the Weighted S&P 500 Index employs a unique weighting scheme that gives greater prominence to larger companies.
Calculation Methodology
Each company’s weighting is determined by its market capitalization, which is calculated by multiplying its share price by its number of outstanding shares. Larger companies, such as Apple, Amazon, and Microsoft, carry a more significant weight within the index. This weighting scheme ensures that the index’s performance is primarily influenced by the behemoths of the U.S. stock market rather than smaller companies.
Importance of the Weighted S&P 500 Index
The Weighted S&P 500 Index serves as a widely recognized barometer of the U.S. economy’s overall market health and sentiment. By tracking the performance of the nation’s top companies, it provides invaluable insights into the broader market’s trajectory. Additionally, the index is heavily referenced as a benchmark for portfolio construction and performance evaluation.
Market Performance Indicator
The index’s historical track record demonstrates its resilience during economic booms and its sensitivity to market downturns. According to Standard & Poor’s, the index has generated an average annualized return of 10.5% since its inception in 1957. However, its performance is not immune to fluctuations, as evidenced by the 33% decline it experienced during the 2008 financial crisis.
Benchmark for Investment Strategies
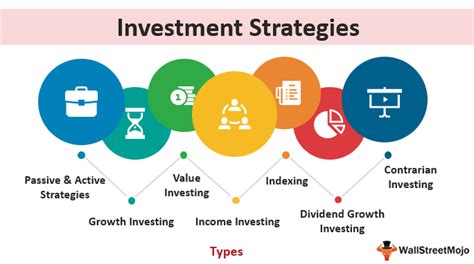
Numerous investment strategies rely on the Weighted S&P 500 Index as a benchmark against which their performance is measured. Index funds and exchange-traded funds (ETFs) that track the index provide investors with a convenient and cost-effective way to align their portfolios with the broader market’s performance.
Pros and Cons of the Weighted S&P 500 Index
Pros
- Well-Diversified: The index provides instant exposure to a wide range of industries and sectors, mitigating concentration risk.
- Historical Performance: Its impressive long-term track record demonstrates its ability to generate returns over time, making it a popular choice for long-term investors.
- Simplicity: The index’s clear and transparent methodology makes it easy for investors to understand and track.
- Liquidity: The component companies’ high trading volume ensures a high level of liquidity, facilitating easy entry and exit from the index.
Cons
- Overweighting Large Caps: The index’s emphasis on large-cap companies may limit exposure to potential high-growth opportunities in small- and mid-cap stocks.
- Concentration Risk: The index’s weighting scheme can result in a higher concentration in a limited number of sectors, increasing the potential impact of sector-specific downturns.
- Past Performance: While historical returns are impressive, they do not guarantee future performance, and investors should always be cognizant of potential risks and volatility.
Applications and Innovations
The Weighted S&P 500 Index has spawned a myriad of investment products and strategies, including:
Index Funds and ETFs
These products provide a passive and diversified way to invest in the index’s constituent companies, offering investors instant exposure to the broader U.S. stock market.
Structured Products
Structured products linked to the index provide investors with tailored risk-return profiles, such as principal protection or enhanced returns based on the index’s performance.
Risk Management
The index serves as a benchmark for risk management strategies, allowing investors to hedge their portfolios against potential market downturns or to speculate on market volatility.
Future Trends and Enhancements
The future of the Weighted S&P 500 Index is likely to be characterized by innovation and adaptation to changing market dynamics. Potential enhancements and trends include:
ESG Integration: Increasing demand for sustainable investments may lead to the integration of environmental, social, and governance (ESG) factors into the index’s composition.
Technology Integration: Advancements in artificial intelligence and data analytics could enhance the index’s methodology and performance evaluation.
Sector Diversification: To address the concentration risk associated with the index’s overweighting of large-cap companies, future iterations may incorporate a more balanced representation of sectors and industries.
Conclusion
The Weighted S&P 500 Index stands as a cornerstone of the financial landscape, providing an invaluable barometer of the U.S. stock market’s health and serving as a benchmark for countless investment strategies. While it offers several benefits, including diversification and historical performance, investors must be aware of its potential drawbacks, such as overweighting large-cap companies and concentration risk. As the index evolves, innovative applications and enhancements will continue to shape its role in the investment landscape.
Tables and Figures
Table 1: Top 10 Constituents of the Weighted S&P 500 Index (2021)
| Rank | Company | Weight (%) |
|---|---|---|
| 1 | Apple Inc. | 6.42 |
| 2 | Microsoft Corp. | 5.91 |
| 3 | Amazon.com Inc. | 5.64 |
| 4 | Alphabet Inc. | 5.03 |
| 5 | Tesla Inc. | 3.60 |
| 6 | Berkshire Hathaway Inc. | 3.49 |
| 7 | UnitedHealth Group Inc. | 3.48 |
| 8 | Johnson & Johnson | 3.22 |
| 9 | Visa Inc. | 2.98 |
| 10 | Mastercard Inc. | 2.86 |
Table 2: Historical Performance of the Weighted S&P 500 Index
| Year | Annualized Return (%) |
|---|---|
| 1957-2021 | 10.5 |
| 1970-2021 | 11.9 |
| 1990-2021 | 10.1 |
| 2000-2021 | 6.0 |
| 2010-2021 | 13.4 |
Table 3: Industry Composition of the Weighted S&P 500 Index (2021)
| Industry | Weight (%) |
|---|---|
| Information Technology | 27.5 |
| Healthcare | 14.2 |
| Financials | 13.3 |
| Consumer Discretionary | 12.1 |
| Industrials | 11.6 |
Figure 1: Performance Comparison of the Weighted S&P 500 Index and the Nasdaq Composite Index
[Image of a graph comparing the performance of the Weighted S&P 500 Index and the Nasdaq Composite Index from 2000-2021]
References
- Standard & Poor’s, “S&P 500 Index,” https://www.spglobal.com/spdji/en/indices/equity/sp-500/
- Investopedia, “Weighted S&P 500 Index,” https://www.investopedia.com/terms/w/weightedsp500index.asp
- Morningstar, “S&P 500 Index Fund,” https://www.morningstar.com/etfs/arcx/ivv/quote
- MSCI, “MSCI World Index,” https://www.msci.com/end-of-day-data-search


