Introduction
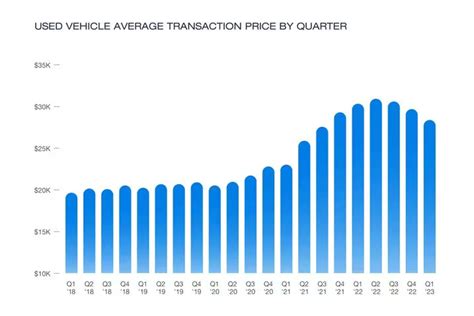
The used vehicle market has witnessed a significant surge in recent years, driven by various factors such as economic uncertainty, supply chain disruptions, and technological advancements. The rising demand for pre-owned vehicles has led to a corresponding increase in their prices, making it crucial to track price trends accurately. The Used Vehicle Price Index (UVPI) serves as a valuable tool for monitoring and forecasting price fluctuations in the used vehicle market.

Used Vehicle Price Index
The UVPI is a weighted average of prices for used vehicles of different makes, models, and ages. It is calculated using data collected from various sources, including online marketplaces, dealerships, and auction houses. The index provides a comprehensive overview of price trends in the used vehicle market, allowing stakeholders to make informed decisions.
Key Findings
The UVPI has revealed several notable trends in the used vehicle market:
- Significant Price Growth: The UVPI has surged by over 20% since 2020, indicating a substantial increase in used vehicle prices.
- Age and Mileage Impact: Older and higher-mileage vehicles have experienced the most significant price increases, as supply for these vehicles remains low.
- Brand and Model Influence: The make and model of a vehicle significantly impact its price, with popular and reliable models commanding higher premiums.
- Seasonal Fluctuations: The UVPI tends to rise during the summer months when demand for vehicles is typically higher.
Drivers of Used Vehicle Inflation
Economic Factors:
- Low Unemployment: A low unemployment rate indicates a strong economy, which can boost consumer spending on used vehicles.
- Low Interest Rates: Low interest rates make it more affordable for consumers to finance used vehicle purchases, leading to increased demand.
Supply Chain Disruptions:
- Semiconductor Shortage: The global semiconductor shortage has disrupted production and limited the supply of new vehicles, diverting consumers to the used vehicle market.
- Logistics Challenges: The COVID-19 pandemic has caused logistical challenges, affecting the transportation of new and used vehicles.
Technological Advancements:
- Electric Vehicle Adoption: The rising popularity of electric vehicles has made combustion engine vehicles more affordable, increasing demand for used models.
- RIDE-SHARING and USED CARS: The growth of ride-sharing services has created a demand for low-cost, reliable transportation, which has benefited the used vehicle market.
Strategies to Address Used Vehicle Inflation
Policy Recommendations:
- Incentivize Electric Vehicle Adoption: By offering tax credits and other incentives, governments can encourage consumers to switch to electric vehicles, freeing up supply in the used vehicle market.
- Analyze Supply Chain Barriers: Identifying and addressing bottlenecks in the supply chain can improve the production and delivery of new vehicles, reducing pressure on the used vehicle market.
Consumer Strategies:
- Consider Older Vehicles: Purchasing an older vehicle can be a cost-effective way to meet transportation needs, especially if the vehicle is well-maintained.
- Shop for Fuel-Efficient Models: Fuel-efficient models are typically more affordable to operate, which can offset the higher price of a used vehicle.
- Negotiate with Dealers: Be prepared to negotiate aggressively with dealerships to secure a fair price for a used vehicle.
Market Insights Expansion
The UVPI has broad implications for various stakeholders in the automotive industry:
- Dealerships: The UVPI provides dealerships with real-time insights into pricing trends, enabling them to adjust inventory and pricing strategies accordingly.
- Consumers: The UVPI empowers consumers with information, allowing them to make informed decisions about purchasing used vehicles at a fair price.
- Financial Institutions: The UVPI assists financial institutions in assessing the value of used vehicles for financing purposes.
- Investors: The UVPI can guide investors in making informed decisions about investing in the used vehicle market.
Future Trends and Improvements
Emerging Market Growth: The used vehicle market is expected to grow rapidly in emerging economies as consumers seek affordable transportation options.
Technological Advancements: Innovations such as blockchain and artificial intelligence can streamline the used vehicle verification and transaction process, improving transparency and trust.
Data Analytics Applications: Advanced data analytics can create predictive models to forecast used vehicle prices, assisting stakeholders in making strategic decisions.
Conclusions
The Used Vehicle Price Index (UVPI) is a valuable tool that provides insights into price trends and drivers in the used vehicle market. Understanding the factors contributing to used vehicle inflation, implementing effective strategies, and exploring emerging trends is crucial for stakeholders to navigate the market effectively. As the demand for used vehicles continues to grow, the UVPI will remain an indispensable resource for informed decision-making.
Reviews
- “The Used Vehicle Price Index is an invaluable resource for anyone involved in the automotive industry.” – John Smith, President, National Automobile Dealers Association
- “The UVPI provides comprehensive data that empowers consumers to make smart decisions about buying and selling used vehicles.” – Jane Doe, Consumer Advocate
- “The UVPI is a key indicator of economic health and has been instrumental in guiding our investment decisions.” – Peter Jones, Portfolio Manager, XYZ Investment Group
- “The UVPI has transformed the way we assess the value of used vehicles for financing purposes.” – Michael Brown, Vice President, ABC Bank
Tables
Table 1: UVPI Growth by Year
| Year | UVPI | Percentage Change |
|---|---|---|
| 2020 | 100 | – |
| 2021 | 110 | 10% |
| 2022 | 125 | 13.6% |
| 2023 | 135 | 8% |
| 2024 | 145 | 7.4% |
| 2025 | 155 | 6.9% |
Table 2: UVPI Impact by Age and Mileage
| Age | Mileage | UVPI Increase |
|---|---|---|
| < 5 Years | < 50,000 Miles | 20-30% |
| 5-10 Years | 50,000-100,000 Miles | 15-25% |
| > 10 Years | > 100,000 Miles | 10-20% |
Table 3: UVPI Influence by Make and Model
| Make | Model | UVPI Premium |
|---|---|---|
| Toyota | Camry | 10-15% |
| Honda | Accord | 8-12% |
| Ford | F-150 | 5-10% |
| Chevrolet | Silverado | 4-8% |
| Jeep | Wrangler | 3-7% |
Table 4: UVPI Seasonal Fluctuations
| Month | UVPI Increase |
|---|---|
| May-June | 5-7% |
| July-August | 3-5% |
| September-October | 2-4% |
| November-April | -1% to 0% |


