Introduction
The VIX Index, also known as the “Fear Gauge,” is a measure of market volatility and a key metric for investors to assess the riskiness of the equity market. This comprehensive guide delves into the nuances of the VIX Index, exploring its significance, applications, and implications for investors.

What is the VIX Index?
The VIX Index is a real-time volatility index that gauges the implied volatility of the S&P 500 Index options over the next 30 days. It is calculated by the Chicago Board Options Exchange (CBOE) and represents the market’s expectations of future market volatility.
Significance of the VIX Index
The VIX Index serves as a bellwether of market sentiment, indicating investor uncertainty and fear. When the VIX is high, it suggests that investors anticipate significant market fluctuations and are seeking protection. Conversely, a low VIX implies a calmer market with less expected volatility.
Applications of the VIX Index
The VIX Index finds wide-ranging applications in investment strategies:
- Risk Assessment: The VIX allows investors to gauge market risk and adjust their portfolio allocations accordingly.
- Options Trading: Options traders utilize the VIX to estimate the potential volatility of underlying assets and price options premiums.
- Volatility Hedging: Institutions and investors employ VIX-linked products to hedge against market fluctuations and minimize potential losses.
VIX Index vs. S&P 500 Index
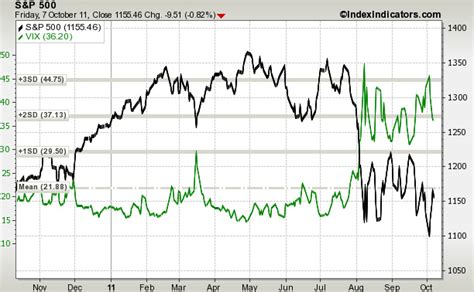
The VIX Index and the S&P 500 Index have an inverse relationship. Historically, when the S&P 500 has been bullish, the VIX has been low, reflecting investor confidence. Conversely, when the S&P 500 has faced uncertainty, the VIX has surged, indicating increased anxiety among investors.
Historical Trends of the VIX Index
The VIX Index has exhibited significant volatility over time, reflecting periods of market tranquility and turbulence. According to the CBOE, the average VIX value from 1990 to 2022 was 19.53. However, during periods of extreme market stress, such as the 2008 financial crisis, the VIX soared to record highs.
Current Status and Future Trends
In 2023, the VIX Index has averaged around 18, indicating a moderate level of market volatility. Many analysts predict that the VIX will remain elevated in the near term due to ongoing geopolitical tensions and economic uncertainty. However, with the Federal Reserve indicating potential policy shifts, the future trajectory of the VIX is subject to change.
Pros and Cons of Using the VIX Index
Pros:
- Provides a real-time gauge of market volatility
- Aids in risk assessment and portfolio management
- Facilitates options trading strategies
Cons:
- May not accurately predict short-term market fluctuations
- Can be influenced by factors unrelated to the equity market
- Limited usefulness in predicting long-term market trends
Potential Applications in Future Investment Strategies
The VIX Index has the potential to enhance investment strategies in innovative ways:
- VIX-Linked ETFs: Investors can gain exposure to the VIX through exchange-traded funds (ETFs) that track its performance, allowing for diversification and risk mitigation.
- Tailored Risk Management: The VIX can be integrated into risk models to create customized investment portfolios that match specific risk tolerance levels.
- Volatility-Adjusted Asset Allocation: By adjusting asset allocations based on the VIX, investors can dynamically adapt their portfolios to changing market conditions.
Conclusion
The VIX Index is an essential tool for investors seeking to understand market volatility and manage risk. Its applications extend across risk assessment, options trading, and volatility hedging. While the VIX Index does not perfectly predict short-term market movements, it provides valuable insights into investor sentiment and helps shape investment strategies.
Tables
| Year | Average VIX Value |
|---|---|
| 1990-2022 | 19.53 |
| 2010 | 15.51 |
| 2015 | 13.20 |
| 2020 | 25.72 |
| VIX Range | Implied Volatility |
|---|---|
| Below 10 | Low volatility, bullish sentiment |
| 10-20 | Moderate volatility, balancing risk |
| 20-30 | High volatility, increasing uncertainty |
| Above 30 | Extreme volatility, market panic |
| VIX ETF | Ticker |
|---|---|
| VelocityShares VIX Short-Term ETN | VIXY |
| ProShares Ultra VIX Short-Term Futures ETF | UVXY |
| iPath Series B S&P 500 VIX Short-Term Futures ETN | VXX |
| VIX-Linked Risk Management Strategy | Description |
|---|---|
| Volatility-Weighted Portfolio | Adjusts portfolio weighting based on VIX value |
| Risk-Parity Portfolio | Allocates assets to achieve a balanced risk profile, using VIX as a volatility measure |
| Dynamic Tail Hedging | Employs VIX futures to protect against extreme market downturns |


