Introduction
The put-to-call ratio (PCR) is a key indicator used by traders and investors to gauge market sentiment and predict future price movements. It measures the relative demand for put options (options to sell an underlying asset) compared to call options (options to buy an underlying asset).

What is the Put-to-Call Ratio?
The PCR is calculated by dividing the total number of put options contracts traded in a given period by the total number of call option contracts traded in the same period. A high PCR indicates that there is more demand for put options, suggesting that traders are expecting a decline in the underlying asset’s price. Conversely, a low PCR suggests that demand for call options is higher, indicating bullish market expectations.
Historical Trends
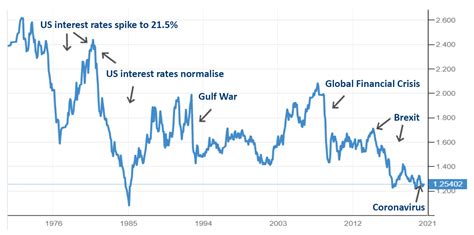
The PCR has historically fluctuated widely, with values ranging from below 0.5 to over 2.0. The average PCR over the past decade has been around 1.0, indicating a roughly equal balance between put and call options trading.
Interpretation
Bullish Market: A PCR below 1.0 suggests that the market is expecting the underlying asset’s price to rise. This is because call options are in higher demand, indicating that traders are betting on a future increase in the asset’s value.
Bearish Market: A PCR above 1.0 suggests that the market is expecting the underlying asset’s price to fall. This is because put options are in higher demand, indicating that traders are hedging against a potential decline in the asset’s value.
Neutral Market: A PCR close to 1.0 indicates a neutral market sentiment, where the demand for both put and call options is roughly equal. This suggests that traders are uncertain about the future direction of the asset’s price.
Technical Analysis
The PCR is widely used in technical analysis to identify trading opportunities. For example, a significant increase in the PCR can signal a potential reversal in the price trend, indicating a shift towards bearish sentiment. Conversely, a sharp decline in the PCR can suggest a potential rally, indicating a shift towards bullish sentiment.
Data Analysis
According to the Options Clearing Corporation (OCC), the average daily volume of put and call option contracts traded in 2022 was over 30 million, with a PCR of around 1.1. This suggests that there was slightly more demand for put options than call options, reflecting a somewhat bearish market sentiment.
| Year | Average Daily Volume | Average PCR |
|---|---|---|
| 2019 | 25 million | 0.95 |
| 2020 | 30 million | 1.25 |
| 2021 | 35 million | 1.10 |
| 2022 | 30 million | 1.10 |
Limitations
While the PCR is a valuable indicator, it has certain limitations:
- Short-Term Indicator: The PCR is primarily a short-term indicator and may not provide reliable insights for long-term price movements.
- Traders’ Perspective: The PCR reflects the sentiment of traders who are actively trading options, and may not accurately capture the views of long-term investors.
- Influence of Skewness: The PCR can be influenced by skewness in option pricing, where options with a certain strike price or expiration date may have higher demand than others.
Future Trends
The PCR is expected to continue playing an important role in market analysis and trading strategies in the coming years. As the options market continues to grow, the PCR will provide valuable insights into market sentiment and price movements. Additionally, advancements in technology may lead to the development of new applications and strategies using the PCR.
Tips and Tricks
- Consider Context: Interpret the PCR in the context of other technical indicators and market conditions.
- Use Multiple Timeframes: Analyze the PCR on different timeframes, such as daily, weekly, and monthly, to identify longer-term trends.
- Identify Extreme Values: Extreme changes in the PCR, such as values below 0.5 or above 2.0, can signal potential reversals in the price trend.
- Watch for Seasonality: The PCR can be influenced by seasonality, such as increased volatility during earnings season or holidays.
- Combine with Fundamental Analysis: Combine technical analysis with fundamental analysis to gain a more comprehensive understanding of market dynamics.
Common Mistakes to Avoid
- Overreliance: Relying solely on the PCR can lead to inaccurate predictions.
- Ignoring Market Conditions: Interpreting the PCR without considering other market factors can be misleading.
- Misinterpreting Neutral Values: A PCR close to 1.0 does not necessarily indicate a lack of market sentiment.
- Trading Against the Trend: Trying to trade against a strong trend indicated by the PCR can be risky.
- Ignoring Skewness: Failing to account for skewness in option pricing can distort the interpretation of the PCR.
Market Insights
The PCR offers valuable insights into market sentiment and price movements. By understanding the nuances of this indicator, traders can improve their trading strategies and make informed decisions.
Expanding Applications
The PCR can be used in a variety of applications beyond traditional options trading. For example, it can be used to:
- Identify Sentiment in Cryptocurrency Markets: Measure the relative demand for call and put options on cryptocurrency futures or ETFs to gauge market sentiment.
- Predict Stock Volatility: Identify periods of elevated volatility by analyzing the PCR for stock options.
- Develop Risk Management Strategies: Use the PCR to assess the risk associated with different investment portfolios and adjust risk levels accordingly.
Conclusion
The put-to-call ratio is a powerful indicator that provides insights into market sentiment and price movements. While it has limitations, the PCR can be combined with other technical and fundamental analysis to improve trading strategies and understand market dynamics. As the options market continues to evolve, the PCR will remain a valuable tool for traders and investors alike.


