Understanding RSI: A Powerful Technical Indicator
Technical indicators empower market participants to decipher market trends and opportunities. Among these tools, the Relative Strength Index (RSI), introduced by J. Welles Wilder in 1978, stands out as a highly effective tool for analyzing price momentum and identifying overbought or oversold conditions.

Interpreting RSI Values
RSI oscillates between 0 and 100, with values typically interpreted as follows:
- Oversold:RSI below 30 indicates a market is potentially undervalued, providing buying opportunities.
- Overbought: RSI above 70 suggests a market is overextended and vulnerable to downtrends.
- Neutral: RSI values between 30 and 70 indicate a balanced market, neither overbought nor oversold.
Leveraging RSI in Trading Strategies
Traders leverage RSI to identify potential opportunities in several ways:
Divergence Trading
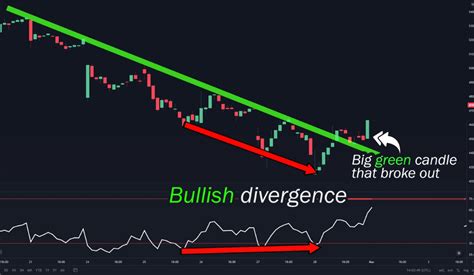
Divergence occurs when RSI readings diverge from price action. For example:
- Bullish Divergence: Rising prices accompanied by declining RSI values signal potential buying opportunities.
- Bearish Divergence: Falling prices with rising RSI values suggest potential sell signals.
Overbought/Oversold Conditions
RSI is commonly used to identify overbought or oversold conditions, providing a contrarian trading strategy:
- Buy: Identify periods when RSI dips below 30, potentially indicating a buying opportunity.
- Sell: Identify periods when RSI rises above 70, suggesting a potential sell signal.
Trend Confirmation
RSI can also confirm emerging trends:
- Upward Trends: Consistently high RSI values above 50 often accompany bullish price trends.
- Downward Trends: Consistently low RSI values below 50 often accompany bearish price trends.
RSI for Beginners: A Step-by-Step Guide
Calculating RSI involves a straightforward formula using 14-day periods, as follows:
- Calculate the Average Gain (AG) over the last 14 periods: AG = Sum of gains over 14 periods / Number of periods (14)
- Calculate the Average Loss (AL) over the last 14 periods: AL = Sum of losses over 14 periods / Number of periods (14)
- Calculate the Relative Strength (RS) using the AG and AL: RS = AG / AL
- Calculate the RSI using the RS: RSI = 100 – 100 / (1 + RS)
Advanced RSI Applications
Beyond its core functions, innovative applications of RSI are emerging:
Multi-Time Frame Analysis
Applying RSI across multiple time frames can provide insights into long-term and short-term market dynamics.
RSI Stochastics
Combining RSI with stochastic oscillators can enhance overbought/oversold identification and confirm trading signals.
Composite RSI
Combining RSI values from multiple markets or instruments can provide a broader market-wide perspective.
Tables for RSI Analysis
Table 1: Key RSI Thresholds
| Value | Interpretation |
|---|---|
| < 30 | Oversold |
| 30-70 | Neutral |
| > 70 | Overbought |
Table 2: RSI Divergence Patterns
| Pattern | Interpretation |
|---|---|
| Bullish Divergence | Rising prices with falling RSI |
| Bearish Divergence | Falling prices with rising RSI |
Table 3: RSI Trading Signals
| Signal | RSI Value |
|---|---|
| Buy | < 30 |
| Sell | > 70 |
Table 4: Advanced RSI Applications
| Application | Description |
|---|---|
| Multi-Time Frame Analysis | Apply RSI across different time frames |
| RSI Stochastics | Combine RSI with stochastic oscillators |
| Composite RSI | Combine RSI values from multiple markets |
Frequently Asked Questions (FAQs)
- What is the best RSI period to use? The standard 14-day period is commonly used, but traders may adjust it based on market conditions.
- Can RSI be used for all markets? RSI is applicable to most markets, but its effectiveness may vary depending on the market’s liquidity and volatility.
- Is RSI a lagging indicator? Yes, RSI is a lagging indicator because it is based on historical price data.
- What are the limitations of RSI? RSI can be misleading in choppy or volatile markets and should be used in conjunction with other technical indicators.
- How do I improve my RSI analysis skills? Practice using RSI in different market conditions and combine it with other indicators to enhance your trading decisions.
- Can RSI help me make profitable trades? RSI is a valuable tool for identifying potential trading opportunities, but successful trading requires a comprehensive approach incorporating risk management and trading psychology.
Conclusion
The Relative Strength Index (RSI) is a versatile technical indicator that provides valuable insights into market momentum and identifying overbought or oversold conditions. By understanding RSI values, traders can develop effective strategies to navigate market trends and maximize their trading opportunities.


